本文主要介绍了matplotlib 多个图像共用一个colorbar的实现示例,分享给大家,具体如下:
# -*- coding: utf-8 -*-
"""
Created on Sat Sep 5 18:05:11 2020
@author: 15025
draw three figures with one common colorbar
"""

import numpy as np
import matplotlib.pyplot as plt
from mpl_toolkits.axes_grid1 import ImageGrid


class Visualazation:
  def mainProgram(self):
    # Set up figure and image grid
    fig = plt.figure(figsize=(8, 4))

    grid = ImageGrid(fig, 111,
             nrows_ncols=(1,3),
             axes_pad=0.15,
             share_all=True,
             cbar_location="right",
             cbar_mode="single",
             cbar_size="7%",
             cbar_pad=0.15,
             )

    # Add data to image grid
    for ax in grid:
      im = ax.imshow(np.random.random((10,10)), vmin=0, vmax=1)

    # Colorbar
    ax.cax.colorbar(im)
    ax.cax.toggle_label(True)

    plt.show()


if __name__ == "__main__":
  main = Visualazation()
  main.mainProgram()
结果为:
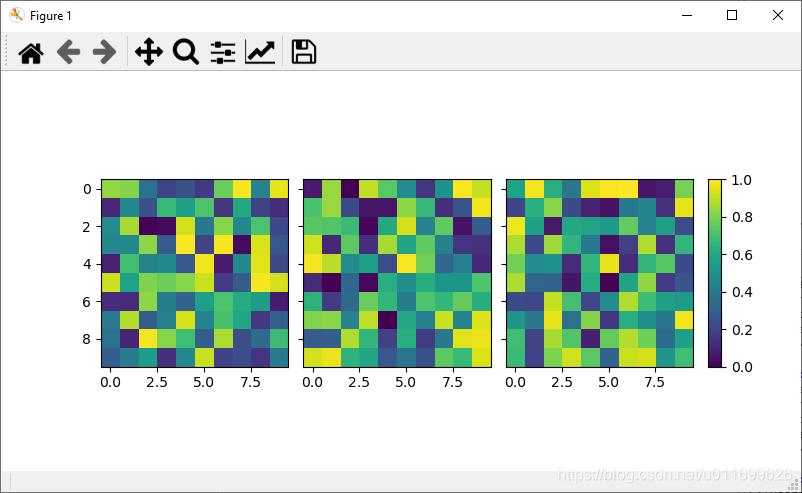
ImageGrid()函数参数说明:nrows_ncols=(1,3)表示创建一个1行3列的画布。share_all=True表示所画的图像公用x坐标轴和y坐标轴。cbar_location="right"表示colorbar位于图像的右侧,当然也可以位于上方,下方和左侧。cbar_mode="single"表示三个图像公用一个colorbar。cbar_size="7%"表示colorbar的尺寸,默认值为5%。cbar_pad=0.15表示图像与colorbar之间的填充间距,默认值为5%。可以自行调整以上数值进行尝试。到此这篇关于matplotlib 多个图像共用一个colorbar的实现示例的文章就介绍到这了,更多相关matplotlib 共用colorbar内容请搜索python博客以前的文章或继续浏览下面的相关文章希望大家以后多多支持python博客!
-
<< 上一篇 下一篇 >>
标签:numpy matplotlib
matplotlib 多个图像共用一个colorbar的实现示例
看: 2024次 时间:2020-09-22 分类 : 数据分析
- 相关文章
- 2021-12-20python数据挖掘使用Evidently创建机器学习模型仪表板
- 2021-12-20Python多进程共享numpy 数组的方法
- 2021-12-20python数据分析近年比特币价格涨幅趋势分布
- 2021-12-20python调用matlab的方法详解
- 2021-12-20python学习与数据挖掘应知应会的十大终端命令
- 2021-07-20pandas中NaN缺失值的处理方法
- 2021-07-20Python数据分析入门之数据读取与存储
- 2021-07-20Python 如何读取字典的所有键-值对
- 2021-07-20如何获取numpy的第一个非0元素索引
- 2021-07-20Python机器学习之KNN近邻算法
-
搜索
-
-
推荐资源
-
Powered By python教程网 鲁ICP备18013710号
python博客 - 小白学python最友好的网站!