在使用matplotlib画图时,少不了对性能图形做出一些说明和补充。一般情况下,loc属性设置为'best'就足够应付了
plt.legend(handles = [l1, l2,], labels = ['a', 'b'], loc = 'best')
或直接loc = 0
plt.legend(handles = [l1, l2,], labels = ['a', 'b'], loc = 0)
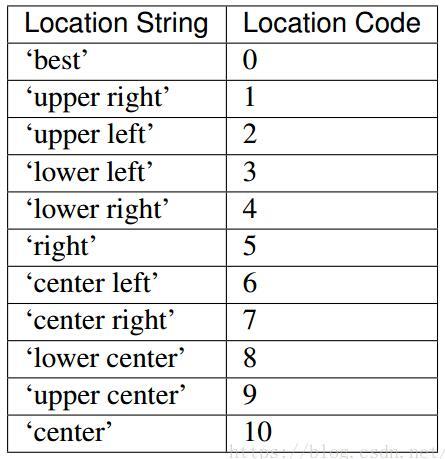
除'best',另外loc属性有:
'upper right', 'upper left', 'lower left', 'lower right', 'right', 'center left', 'center right', 'lower center', 'upper center', 'center'
不说太多,上面是全部的快捷使用,满足一般需求。
demo:
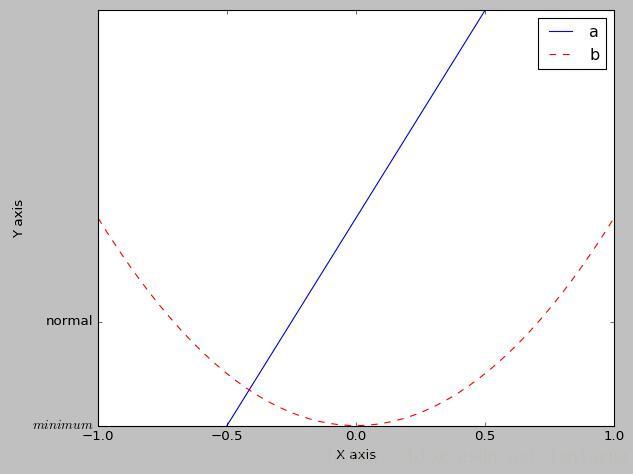
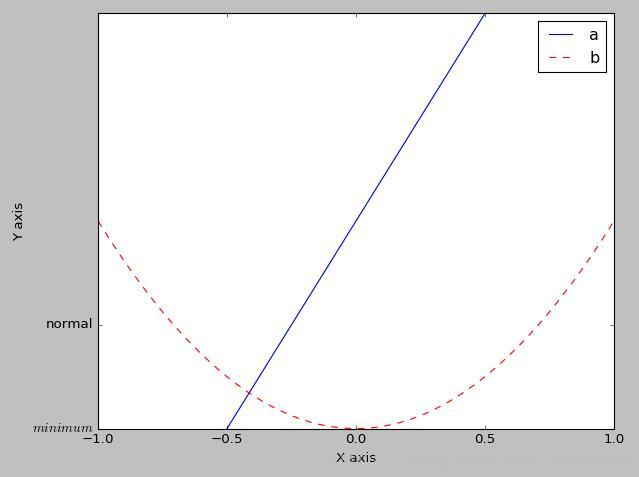
import matplotlib.pyplot as plt
import numpy as np

# 绘制普通图像
x = np.linspace(-1, 1, 50)
y1 = 2 * x + 1
y2 = x**2

plt.figure()
# 在绘制时设置lable, 逗号是必须的
l1, = plt.plot(x, y1, label = 'line')
l2, = plt.plot(x, y2, label = 'parabola', color = 'red', linewidth = 1.0, linestyle = '--')

# 设置坐标轴的取值范围
plt.xlim((-1, 1))
plt.ylim((0, 2))

# 设置坐标轴的lable
plt.xlabel('X axis')
plt.ylabel('Y axis')

# 设置x坐标轴刻度, 原来为0.25, 修改后为0.5
plt.xticks(np.linspace(-1, 1, 5))
# 设置y坐标轴刻度及标签, $$是设置字体
plt.yticks([0, 0.5], ['$minimum$', 'normal'])

# 设置legend
plt.legend(handles = [l1, l2,], labels = ['a', 'b'], loc = 'best')
plt.show()
运行结果:
补充知识:设置图列(key/legend)的位置和大小 --gnuplot
先看几个例子:
//不显示图例。
unset key
//设置图例 显示在图形(内)的顶部居中,并且多个图例水平显示。
set key top horizontal center
//设置图例 显示在图形(外)的顶部居中,并且多个图例水平显示。
set key top outside horizontal center
//设置图例 显示的字体并加粗。
set key font "Times,18,Bold"
//调整图例行间隔
set key spacing 3
//调整图例中线段示例长度
set key samplen 2set key 的语法规则
Syntax:
   set key {on|off} {default}
       {{inside | outside} | {lmargin | rmargin | tmargin | bmargin}
        | {at <position>}}
       {left | right | center} {top | bottom | center}
       {vertical | horizontal} {Left | Right}
       {{no}reverse} {{no}invert}
       {samplen <sample_length>} {spacing <vertical_spacing>}
       {width <width_increment>}
       {height <height_increment>}
       {{no}autotitle {columnheader}}
       {title "<text>"} {{no}enhanced}
       {{no}box { {linestyle | ls <line_style>}
            | {linetype | lt <line_type>}
             {linewidth | lw <line_width>}}}
   unset key
   show key
Elements within the key are stacked according to vertical or horizontal. In the case of vertical, the key occupies as few columns as possible. That is, elements are aligned in a column until running out of vertical space at which point a new column is started. In the case of horizontal, the key occupies as few rows as possible.
图例是依据我们设置的水平显示或垂直显示进行堆叠式地显示。
对于垂直显示,pnuplot会占用尽可能少的行来放置我们的图例,当图例在一行显示不下时,它会另启一行来显示。
对于水平显示方式,pnuplot会占用尽可能少的列来放置我们的图例,当图例在一列显示不下时,它会另启一列来放置。
The vertical spacing between lines is controlled by spacing. The spacing is set equal to the product of the pointsize, the vertical tic size, and vertical_spacing. The program will guarantee that the vertical spacing is no smaller than the character height.
The defaults for set key are on, right, top, vertical, Right, noreverse, noinvert, samplen 4, spacing 1.25, title “”, and nobox.
以上这篇关于matplotlib-legend 位置属性 loc 使用说明就是小编分享给大家的全部内容了,希望能给大家一个参考,也希望大家多多支持python博客。
-
<< 上一篇 下一篇 >>
标签:numpy matplotlib
关于matplotlib-legend 位置属性 loc 使用说明
看: 2198次 时间:2020-07-08 分类 : 数据分析
- 相关文章
- 2021-12-20python数据挖掘使用Evidently创建机器学习模型仪表板
- 2021-12-20Python多进程共享numpy 数组的方法
- 2021-12-20python数据分析近年比特币价格涨幅趋势分布
- 2021-12-20python调用matlab的方法详解
- 2021-12-20python学习与数据挖掘应知应会的十大终端命令
- 2021-07-20pandas中NaN缺失值的处理方法
- 2021-07-20Python数据分析入门之数据读取与存储
- 2021-07-20Python 如何读取字典的所有键-值对
- 2021-07-20如何获取numpy的第一个非0元素索引
- 2021-07-20Python机器学习之KNN近邻算法
-
搜索
-
-
推荐资源
-
Powered By python教程网 鲁ICP备18013710号
python博客 - 小白学python最友好的网站!