在
matplotlib中常用的标题主要三种:窗口标题、图像标题和子图标题。
先通过三个案例简要说明这三类标题的实现。窗口标题、图像标题,子图标题(仅1个子图)
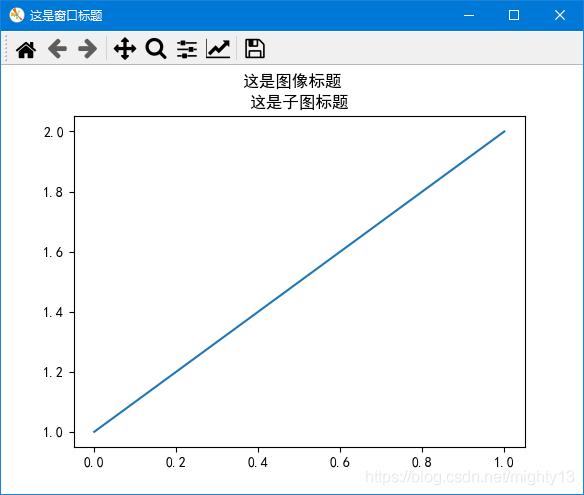
import matplotlib.pyplot as plt

plt.rcParams['font.sans-serif'] = 'SimHei'

fig = plt.figure()
plt.plot([1, 2])
# 设置图像标题
plt.suptitle("这是图像标题")
# 设置子图标题
plt.title("这是子图标题")
# 获取默认窗口标题
current_title = fig.canvas.manager.window.windowTitle()
print("默认窗口:",current_title)
# 设置窗口标题方式一
fig.canvas.set_window_title("这是窗口标题")
# 设置窗口标题方式二
fig.canvas.manager.window.setWindowTitle("这是窗口标题")

plt.show()
窗口标题、图像标题、子图标题(多子图)
使用
subplot函数实现子图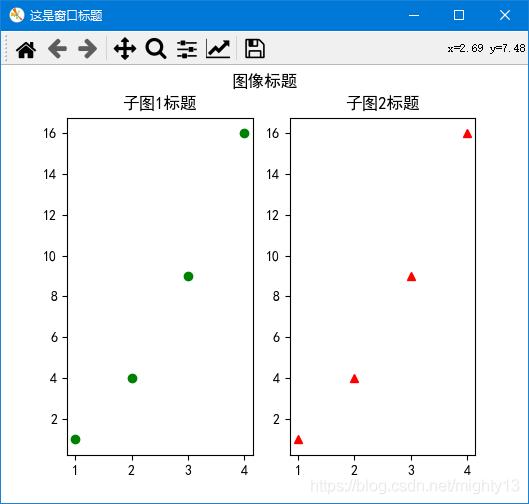
import matplotlib.pyplot as plt

plt.rcParams['font.sans-serif'] = 'SimHei'

fig = plt.figure()
plt.subplot(1, 2, 1)
plt.plot([1,2,3,4], [1,4,9,16], "go")
# 设置子图1标题
plt.title("子图1标题")

plt.subplot(122)
plt.plot([1,2,3,4], [1,4,9,16], "r^") # r^ 表示 红色(red)三角
# 设置子图2标题
plt.title("子图2标题")
# 设置图像标题
plt.suptitle("图像标题")
# 设置窗口标题
#fig.canvas.set_window_title("这是窗口标题")
fig.canvas.manager.window.setWindowTitle("这是窗口标题")

plt.show()
使用subplots函数subplots实现子图
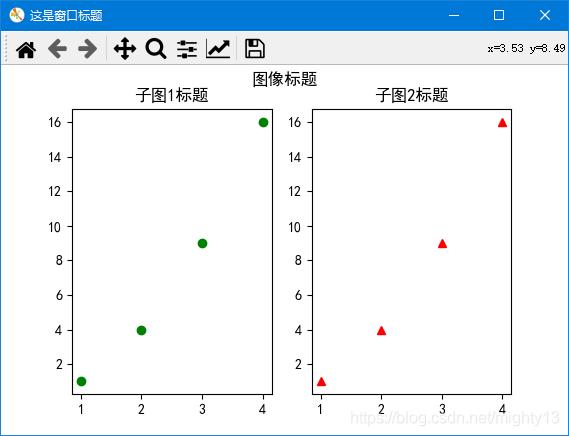
import matplotlib.pyplot as plt

plt.rcParams['font.sans-serif'] = 'SimHei'

fig, ax = plt.subplots(nrows=1, ncols=2, figsize=(6,6))
ax[0].plot([1,2,3,4], [1,4,9,16], "go")
# 设置子图1标题
ax[0].set_title("子图1标题")
ax[1].plot([1,2,3,4], [1,4,9,16], "r^")
# 设置子图2标题
ax[1].set_title("子图2标题")
# 设置图像标题
plt.suptitle("图像标题")
# 设置窗口标题
fig.canvas.manager.window.setWindowTitle("这是窗口标题")

plt.show()
原理分析
通过前面三个案例可知:
窗口标题
设置窗口标题可以用两种方法:
一种是调用figure.canvas对象的set_window_title方法,一种是figure.canvas.manager.window对象的setWindowTitle方法。通过下面源码可知,这两种方法其实是等价的。
因此在日常实现过程中,关键是获取当前图像对象(figure),即案例中的fig。该方法只有一个参数,类型为字符串。
可以通过
通过
figure.canvas.manager.window对象的windowTitle方法可以获取窗口标题。class FigureManagerQT(FigureManagerBase): def set_window_title(self, title): self.window.setWindowTitle(title)图像标题
调用
plt.suptitle函数即可。根据源码可知,plt.suptitle函数其实是调用了当前figure对象的suptitle方法。suptitle函数参数def suptitle(self, t, **kwargs): """ Add a centered title to the figure. Parameters ---------- t : str The title text. x : float, default 0.5 The x location of the text in figure coordinates. y : float, default 0.98 The y location of the text in figure coordinates. horizontalalignment, ha : {'center', 'left', right'}, default: 'center' The horizontal alignment of the text relative to (*x*, *y*). verticalalignment, va : {'top', 'center', 'bottom', 'baseline'}, \ default: 'top' The vertical alignment of the text relative to (*x*, *y*). fontsize, size : default: :rc:`figure.titlesize` The font size of the text. See `.Text.set_size` for possible values. fontweight, weight : default: :rc:`figure.titleweight` The font weight of the text. See `.Text.set_weight` for possible values. Returns ------- text The `.Text` instance of the title. Other Parameters ---------------- fontproperties : None or dict, optional A dict of font properties. If *fontproperties* is given the default values for font size and weight are taken from the `.FontProperties` defaults. :rc:`figure.titlesize` and :rc:`figure.titleweight` are ignored in this case. **kwargs Additional kwargs are `matplotlib.text.Text` properties. Examples -------- >>> fig.suptitle('This is the figure title', fontsize=12) """子图标题
- 使用
subplot函数:在所在子图中,使用plt.title函数。 - 使用
subplots函数:使用子图对象调用set_title方法。 plt.title函数和axes.set_title方法的参数相同。
注意,在使用
subplots函数创建子图时,为什么不能使用plt.title函数设置子图标题呢?
根据title函数的源码可知,title函数其实是通过gca()函数获取子图,然后再调用set_title方法设置标题的。根据实验,在使用subplots函数函数创建多个子图时,plt.gca()只能得到最后一个子图的标题,因此,在某些情况下使用plt.title函数可设置最后一个子图的标题。plt.title函数和axes.set_title方法源码def title(label, fontdict=None, loc=None, pad=None, *, y=None, **kwargs): return gca().set_title( label, fontdict=fontdict, loc=loc, pad=pad, y=y, **kwargs)Axes.set_title(self, label, fontdict=None, loc=None, pad=None, *, y=None, **kwargs): """ Set a title for the axes. Set one of the three available axes titles. The available titles are positioned above the axes in the center, flush with the left edge, and flush with the right edge. Parameters ---------- label : str Text to use for the title fontdict : dict A dictionary controlling the appearance of the title text, the default *fontdict* is:: {'fontsize': rcParams['axes.titlesize'], 'fontweight': rcParams['axes.titleweight'], 'color': rcParams['axes.titlecolor'], 'verticalalignment': 'baseline', 'horizontalalignment': loc} loc : {'center', 'left', 'right'}, default: :rc:`axes.titlelocation` Which title to set. y : float, default: :rc:`axes.titley` Vertical axes loation for the title (1.0 is the top). If None (the default), y is determined automatically to avoid decorators on the axes. pad : float, default: :rc:`axes.titlepad` The offset of the title from the top of the axes, in points. Returns ------- `.Text` The matplotlib text instance representing the title Other Parameters ---------------- **kwargs : `.Text` properties Other keyword arguments are text properties, see `.Text` for a list of valid text properties. """plt.gca()实验import matplotlib.pyplot as plt plt.rcParams['font.sans-serif'] = 'SimHei' fig, ax = plt.subplots(nrows=1, ncols=2, figsize=(6,6)) ax[0].plot([1,2,3,4], [1,4,9,16], "go") ax[1].plot([1,2,3,4], [1,4,9,16], "r^") print(plt.gca()) print(ax[0],ax[1])结果为
AxesSubplot(0.547727,0.11;0.352273x0.77)
AxesSubplot(0.125,0.11;0.352273x0.77) AxesSubplot(0.547727,0.11;0.352273x0.77)
到此这篇关于matplotlib源码解析标题实现(窗口标题,标题,子图标题不同之间的差异)的文章就介绍到这了,更多相关matplotlib 标题内容请搜索python博客以前的文章或继续浏览下面的相关文章希望大家以后多多支持python博客!
- 使用
-
<< 上一篇 下一篇 >>
标签:matplotlib
matplotlib源码解析标题实现(窗口标题,标题,子图标题不同之间的差异)
看: 2050次 时间:2021-03-27 分类 : 数据分析
- 相关文章
- 2021-12-20python数据挖掘使用Evidently创建机器学习模型仪表板
- 2021-12-20Python多进程共享numpy 数组的方法
- 2021-12-20python数据分析近年比特币价格涨幅趋势分布
- 2021-12-20python调用matlab的方法详解
- 2021-12-20python学习与数据挖掘应知应会的十大终端命令
- 2021-07-20pandas中NaN缺失值的处理方法
- 2021-07-20Python数据分析入门之数据读取与存储
- 2021-07-20Python 如何读取字典的所有键-值对
- 2021-07-20如何获取numpy的第一个非0元素索引
- 2021-07-20Python机器学习之KNN近邻算法
-
搜索
-
-
推荐资源
-
Powered By python教程网 鲁ICP备18013710号
python博客 - 小白学python最友好的网站!