基于python代码的3D地图可视化,供大家参考,具体内容如下
介绍
使用Python对地图进行3D可视化。以地图为地图,可以在三维空间对轨迹、点进行可视化。
库
我们使用了多个库:
1.gdal;
主要是用于读取地图信息,这个库在GIS中很常用,使用C++代码编写的,如果安装不了需要在pypi里面找一下对应的资源。2.opencv;
很常用的图像处理库。3.matplotlib;
常用的可视化库结果
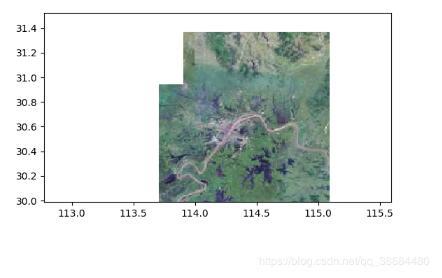
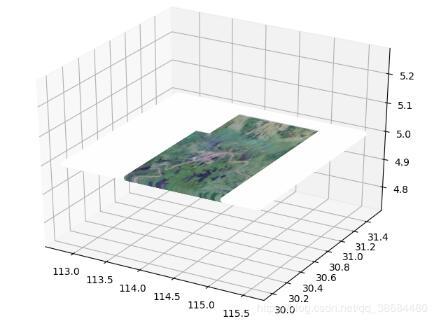
废话不多说直接上结果:
代码
直接上代码,代码很简单。
from osgeo import gdal
import cv2
gdal.UseExceptions()

ds = gdal.Open('E:/Pythoncode/读取地理信息/无标题.tif')
bandg = ds.GetRasterBand(1)
elevationg = bandg.ReadAsArray()

bandr = ds.GetRasterBand(2)
elevationr = bandr.ReadAsArray()

bandb = ds.GetRasterBand(3)
elevationb = bandb.ReadAsArray()

import matplotlib.pyplot as plt
nrows, ncols = elevationr.shape

elevation= cv2.merge([elevationg,elevationr,elevationb])#
# I'm making the assumption that the image isn't rotated/skewed/etc.
# This is not the correct method in general, but let's ignore that for now
# If dxdy or dydx aren't 0, then this will be incorrect
x0, dx, dxdy, y0, dydx, dy = ds.GetGeoTransform()

x1 = x0 + dx * ncols
y1 = y0 + dy * nrows

plt.imshow(elevation, cmap='gist_earth', extent=[x0, x1, y1, y0])
plt.show()

from PIL import Image
from mpl_toolkits.mplot3d import Axes3D
import matplotlib.pyplot as plt
fig = plt.figure()
ax = Axes3D(fig)

img = Image.open('E:/Pythoncode/读取地理信息/无标题.tif')
xx=[]
yy=[]
colall=[]
x = img.size[0]
y = img.size[1]
for i in range(x):
 for j in range(y):

 r = hex(img.getpixel((i, j))[0])[2:]
 b = hex(img.getpixel((i, j))[1])[2:]
 g = hex(img.getpixel((i, j))[2])[2:]

 if len(r) == 1:
 r = '0' + r
 if len(b) == 1:
 b = '0' + b
 if len(g) == 1:
 g = '0' + g
 col = '#' + r + b + g
 colall.append(col)
 xx.append(x0 + dx * i)
 yy.append(y0 + dy * j)
 # col = '#FF00FF'
ax.scatter(xx, yy, 5, c=colall, alpha=0.5)
plt.show()
以上就是本文的全部内容,希望对大家的学习有所帮助,也希望大家多多支持python博客。
-
<< 上一篇 下一篇 >>
标签:matplotlib
python实现3D地图可视化
看: 2173次 时间:2020-07-30 分类 : python教程
- 相关文章
- 2021-12-20Python 实现图片色彩转换案例
- 2021-12-20python初学定义函数
- 2021-12-20图文详解Python如何导入自己编写的py文件
- 2021-12-20python二分法查找实例代码
- 2021-12-20Pyinstaller打包工具的使用以及避坑
- 2021-12-20Facebook开源一站式服务python时序利器Kats详解
- 2021-12-20pyCaret效率倍增开源低代码的python机器学习工具
- 2021-12-20python机器学习使数据更鲜活的可视化工具Pandas_Alive
- 2021-12-20python读写文件with open的介绍
- 2021-12-20Python生成任意波形并存为txt的实现
-
搜索
-
-
推荐资源
-
Powered By python教程网 鲁ICP备18013710号
python博客 - 小白学python最友好的网站!