在用python进行图像处理时,二值化是非常重要的一步,现总结了自己遇到过的6种 图像二值化的方法(当然这个绝对不是全部的二值化方法,若发现新的方法会继续新增)。
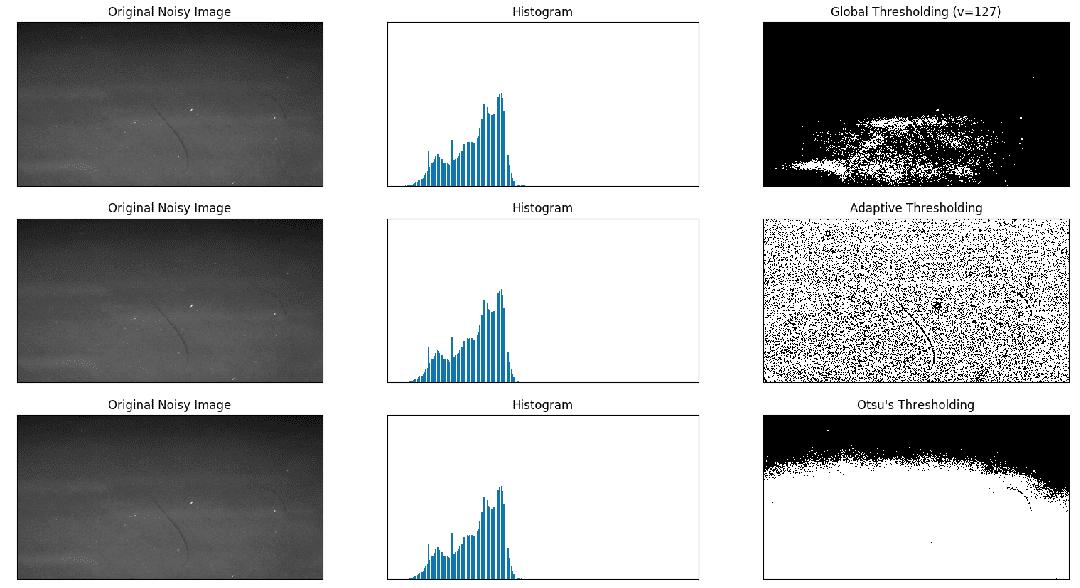
1. opencv 简单阈值 cv2.threshold
2. opencv 自适应阈值 cv2.adaptiveThreshold (自适应阈值中计算阈值的方法有两种:mean_c 和 guassian_c ,可以尝试用下哪种效果好)
3. Otsu's 二值化
例子:
import cv2
import numpy as np
from matplotlib import pyplot as plt

img = cv2.imread('scratch.png', 0)
# global thresholding
ret1, th1 = cv2.threshold(img, 127, 255, cv2.THRESH_BINARY)
# Otsu's thresholding
th2 = cv2.adaptiveThreshold(img, 255, cv2.ADAPTIVE_THRESH_MEAN_C, cv2.THRESH_BINARY, 11, 2)
# Otsu's thresholding
# 阈值一定要设为 0 !
ret3, th3 = cv2.threshold(img, 0, 255, cv2.THRESH_BINARY + cv2.THRESH_OTSU)
# plot all the images and their histograms
images = [img, 0, th1, img, 0, th2, img, 0, th3]
titles = [
  'Original Noisy Image', 'Histogram', 'Global Thresholding (v=127)',
  'Original Noisy Image', 'Histogram', "Adaptive Thresholding",
  'Original Noisy Image', 'Histogram', "Otsu's Thresholding"
]
# 这里使用了 pyplot 中画直方图的方法, plt.hist, 要注意的是它的参数是一维数组
# 所以这里使用了( numpy ) ravel 方法,将多维数组转换成一维,也可以使用 flatten 方法
# ndarray.flat 1-D iterator over an array.
# ndarray.flatten 1-D array copy of the elements of an array in row-major order.
for i in range(3):
  plt.subplot(3, 3, i * 3 + 1), plt.imshow(images[i * 3], 'gray')
  plt.title(titles[i * 3]), plt.xticks([]), plt.yticks([])
  plt.subplot(3, 3, i * 3 + 2), plt.hist(images[i * 3].ravel(), 256)
  plt.title(titles[i * 3 + 1]), plt.xticks([]), plt.yticks([])
  plt.subplot(3, 3, i * 3 + 3), plt.imshow(images[i * 3 + 2], 'gray')
  plt.title(titles[i * 3 + 2]), plt.xticks([]), plt.yticks([])
plt.show()
结果图:
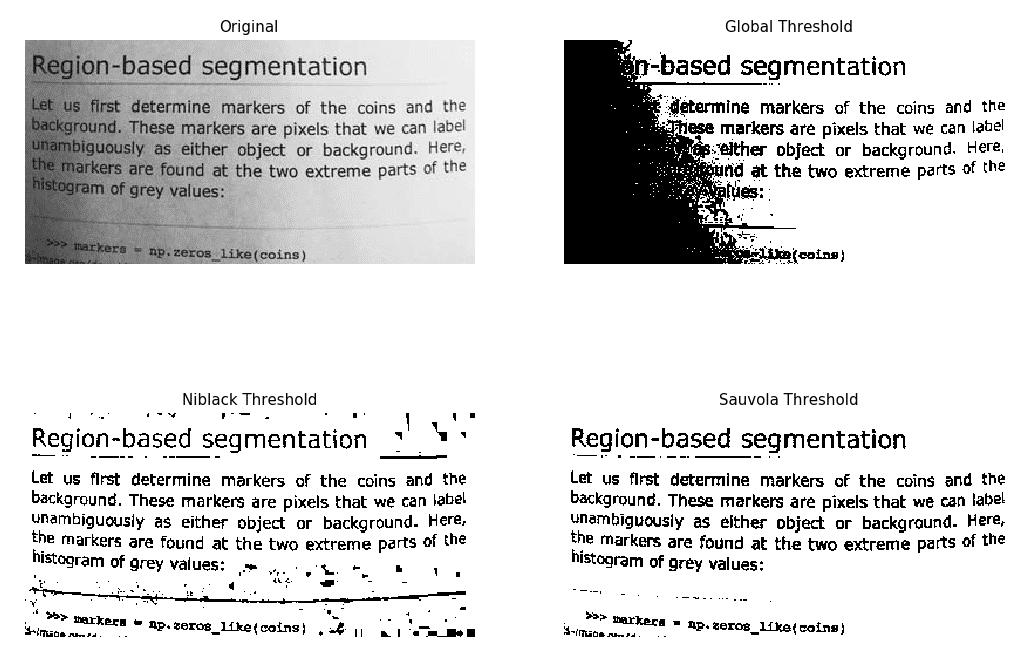
4. skimage niblack阈值
5. skimage sauvola阈值 (主要用于文本检测)
例子:
https://scikit-image.org/docs/dev/auto_examples/segmentation/plot_niblack_sauvola.html
import matplotlib
import matplotlib.pyplot as plt

from skimage.data import page
from skimage.filters import (threshold_otsu, threshold_niblack,
               threshold_sauvola)


matplotlib.rcParams['font.size'] = 9


image = page()
binary_global = image > threshold_otsu(image)

window_size = 25
thresh_niblack = threshold_niblack(image, window_size=window_size, k=0.8)
thresh_sauvola = threshold_sauvola(image, window_size=window_size)

binary_niblack = image > thresh_niblack
binary_sauvola = image > thresh_sauvola

plt.figure(figsize=(8, 7))
plt.subplot(2, 2, 1)
plt.imshow(image, cmap=plt.cm.gray)
plt.title('Original')
plt.axis('off')

plt.subplot(2, 2, 2)
plt.title('Global Threshold')
plt.imshow(binary_global, cmap=plt.cm.gray)
plt.axis('off')

plt.subplot(2, 2, 3)
plt.imshow(binary_niblack, cmap=plt.cm.gray)
plt.title('Niblack Threshold')
plt.axis('off')

plt.subplot(2, 2, 4)
plt.imshow(binary_sauvola, cmap=plt.cm.gray)
plt.title('Sauvola Threshold')
plt.axis('off')

plt.show()
结果图:
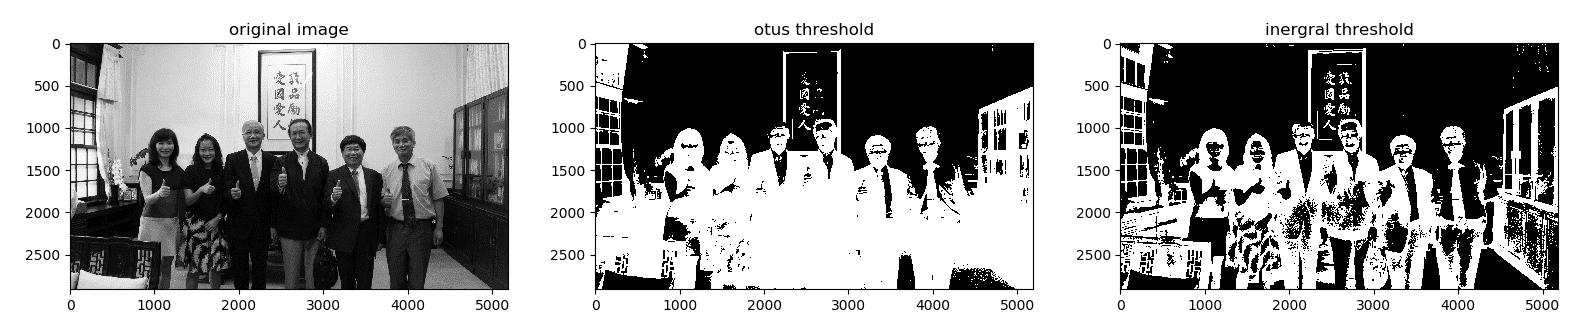
6.IntegralThreshold(主要用于文本检测)
使用方法: 运行下面网址的util.py文件
https://github.com/Liang-yc/IntegralThreshold
结果图:
以上就是本文的全部内容,希望对大家的学习有所帮助,也希望大家多多支持python博客。
- << 上一篇 下一篇 >>
Python图像处理二值化方法实例汇总
看: 3111次 时间:2020-08-24 分类 : python教程
- 相关文章
- 2021-12-20Python 实现图片色彩转换案例
- 2021-12-20python初学定义函数
- 2021-12-20图文详解Python如何导入自己编写的py文件
- 2021-12-20python二分法查找实例代码
- 2021-12-20Pyinstaller打包工具的使用以及避坑
- 2021-12-20Facebook开源一站式服务python时序利器Kats详解
- 2021-12-20pyCaret效率倍增开源低代码的python机器学习工具
- 2021-12-20python机器学习使数据更鲜活的可视化工具Pandas_Alive
- 2021-12-20python读写文件with open的介绍
- 2021-12-20Python生成任意波形并存为txt的实现
-
搜索
-
-
推荐资源
-
Powered By python教程网 鲁ICP备18013710号
python博客 - 小白学python最友好的网站!