背景知识:
FigureCanvasXAgg就是一个渲染器,渲染器的工作就是drawing,执行绘图的这个动作。渲染器是使物体显示在屏幕上
主要内容:
将一个figure渲染的canvas变为一个Qt widgets,figure显示的过程是需要管理器(manager),需要FigureCanvasBase来管理。报错信息'FigureCanvasQTAgg' object has no attribute 'manager'
将一个navigation toolbar渲染成Qt widgets
使用用户事件来实时更新matplotlib plot
matplotlib针对GUI设计了两层结构概念:canvas,renderer。
下面我将以默认自带的后端 tkAgg:from matplotlib.backends.backend_tkagg import FigureCanvasTkAgg as FigureCanvas为例,为大家讲解画布与渲染器的知识。
一. canvas(画布)
对应抽象的类:FigureCanvasBase and FigureManagerBase
作用:
保存对图像的引用
更新图像通过对画布的引用
定义运行注册的事件方法
将本地工具箱事件转为matplotlib事件抽象框架
定义绘制渲染图片的方法
停止和开始nono-GUI事件循环
1. 追寻matplotlib.figure.Figure.show( )
以下引自matplotlib.figure.Figure.show( ) 源码和注释:
#matplotlib.figure.Figure.show( )
def show(self, warn=True):
 """
 If using a GUI backend with pyplot, display the figure window.

 If the figure was not created using
 :func:`~matplotlib.pyplot.figure`, it will lack a
 :class:`~matplotlib.backend_bases.FigureManagerBase`, and
 will raise an AttributeError.

 Parameters
 ----------
 warm : bool
  If ``True``, issue warning when called on a non-GUI backend

 Notes
 -----
 For non-GUI backends, this does nothing, in which case a warning will
 be issued if *warn* is ``True`` (default).
 """
 try:
  manager = getattr(self.canvas, 'manager')
 except AttributeError as err:
  raise AttributeError("%s\n"
        "Figure.show works only "
        "for figures managed by pyplot, normally "
        "created by pyplot.figure()." % err)

 if manager is not None:
  try:
   manager.show()
   return
  except NonGuiException:
   pass
它是通过manager.show()来实现画图的动作的。
2. 追寻plt.show()
而在==plt.show( )==的源码中我们可以查到:
#plt.show()
from matplotlib.backends import pylab_setup
_show = pylab_setup()
def show(*args, **kw):

 global _show
 return _show(*args, **kw)
而我们继续查找就得到了,这是在backends包的__init__.py模块里的代码,代码说了一大堆,无非就是说它返回了四个对象:backend_mod, new_figure_manager, draw_if_interactive, show。而show就是show = getattr(backend_mod, 'show', do_nothing_show)得到的其中backend_mod就是要导入模块的绝对路径,之后验证的show就是matplotlib.backends.backend_tkagg._BackendTkAgg,继续追寻之后我们得到class _BackendTkAgg(_BackendTk): FigureCanvas = FigureCanvasTkAgg,之后我们用help函数得到
show(block=None) method of builtins.type instance
 Show all figures.

 `show` blocks by calling `mainloop` if *block* is ``True``, or if it
 is ``None`` and we are neither in IPython's ``%pylab`` mode, nor in
 `interactive` mode.
我们继续刨根,寻找从FigureCanvas开始的类的关系和其方法,类的继承结构关系如下图
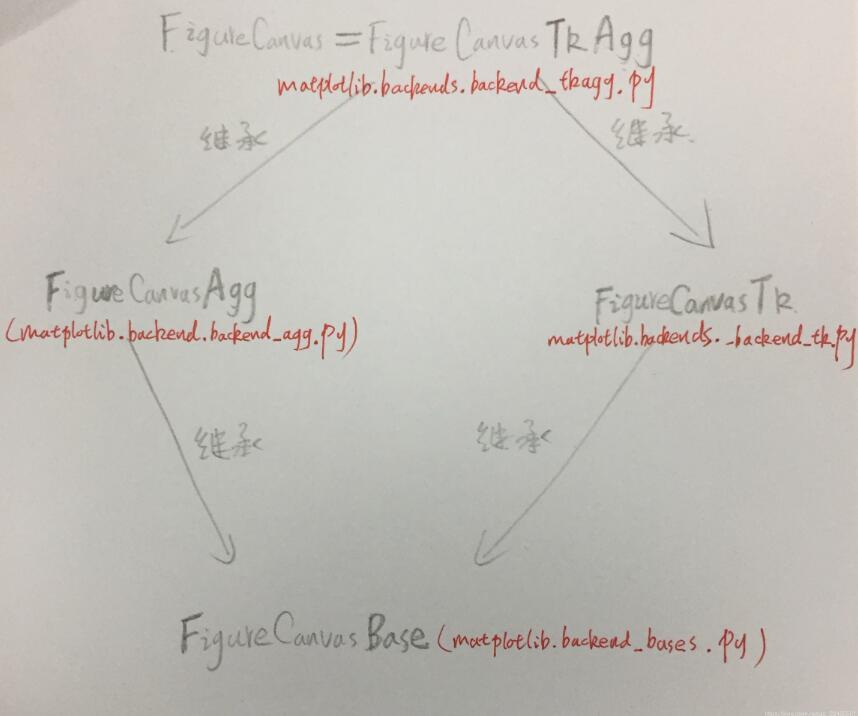
然后终于在FigureCnavasTk类的声明中找到了这样的一句声明:
show = cbook.deprecated("2.2", name="FigureCanvasTk.show",
       alternative="FigureCanvasTk.draw")(
        lambda self: self.draw())
也就是说show归根结底是backend里的一个FigureCanvasTk.draw()的一个变形 !
pylab_setup代码如下:
def pylab_setup(name=None):
 '''return new_figure_manager, draw_if_interactive and show for pyplot

 This provides the backend-specific functions that are used by
 pyplot to abstract away the difference between interactive backends.

 Parameters
 ----------
 name : str, optional
  The name of the backend to use. If `None`, falls back to
  ``matplotlib.get_backend()`` (which return :rc:`backend`).

 '''
 # Import the requested backend into a generic module object
 if name is None:
  # validates, to match all_backends
  name = matplotlib.get_backend()
 if name.startswith('module://'):
  backend_name = name[9:]
 else:
  backend_name = 'backend_' + name
  backend_name = backend_name.lower() # until we banish mixed case
  backend_name = 'matplotlib.backends.%s' % backend_name.lower()

 # the last argument is specifies whether to use absolute or relative
 # imports. 0 means only perform absolute imports.
 #得到模块的绝对路径backend_mod,然后通过绝对路径加.就可以调用各个抽象类
 #<module 'matplotlib.backends.backend_tkagg' from 'D:\\Python36\\lib\\site-packages\\matplotlib\\backends\\backend_tkagg.py'>默认实验的!
 backend_mod = __import__(backend_name, globals(), locals(),
        [backend_name], 0)

 # Things we pull in from all backends
 new_figure_manager = backend_mod.new_figure_manager

 # image backends like pdf, agg or svg do not need to do anything
 # for "show" or "draw_if_interactive", so if they are not defined
 # by the backend, just do nothing
 def do_nothing_show(*args, **kwargs):
  frame = inspect.currentframe()
  fname = frame.f_back.f_code.co_filename
  if fname in ('<stdin>', '<ipython console>'):
   warnings.warn("""
Your currently selected backend, '%s' does not support show().
Please select a GUI backend in your matplotlibrc file ('%s')
or with matplotlib.use()""" %
       (name, matplotlib.matplotlib_fname()))

 def do_nothing(*args, **kwargs):
  pass

 backend_version = getattr(backend_mod, 'backend_version', 'unknown')

 show = getattr(backend_mod, 'show', do_nothing_show)

 draw_if_interactive = getattr(backend_mod, 'draw_if_interactive',
         do_nothing)

 _log.debug('backend %s version %s', name, backend_version)

 # need to keep a global reference to the backend for compatibility
 # reasons. See https://github.com/matplotlib/matplotlib/issues/6092
 global backend
 backend = name
 return backend_mod, new_figure_manager, draw_if_interactive, show
3. 追寻plt.figure()
我们创建的这个figure必须有manager,否则则会报错,如果是plt.figure初始化的,plt.figure( )源码如下:
plt.figure()示例
def figure():

 figManager = _pylab_helpers.Gcf.get_fig_manager(num)

 figManager = new_figure_manager(num,figsize=figsize,dpi=dpi,facecolor=facecolor,edgecolor=edgecolor,frameon=frameon,FigureClass=FigureClass,**kwargs)
 ......
 ......
 return figManager.canvas.figure
4. 追寻matplotlib.figure.Figure()
而在matplotlib.figure.Figure() 中,其初始化函数__init__(),并没有默认生成manager这个属性,所以在调用show的时候,就会报错!如上其show函数定义的那样
 def __init__(self,
     figsize=None, # defaults to rc figure.figsize
     dpi=None, # defaults to rc figure.dpi
     facecolor=None, # defaults to rc figure.facecolor
     edgecolor=None, # defaults to rc figure.edgecolor
     linewidth=0.0, # the default linewidth of the frame
     frameon=None, # whether or not to draw the figure frame
     subplotpars=None, # default to rc
     tight_layout=None, # default to rc figure.autolayout
     constrained_layout=None, # default to rc
           #figure.constrained_layout.use
     ):
  """
  Parameters
  ----------
  figsize : 2-tuple of floats
   ``(width, height)`` tuple in inches

  dpi : float
   Dots per inch

  facecolor
   The figure patch facecolor; defaults to rc ``figure.facecolor``

  edgecolor
   The figure patch edge color; defaults to rc ``figure.edgecolor``

  linewidth : float
   The figure patch edge linewidth; the default linewidth of the frame

  frameon : bool
   If ``False``, suppress drawing the figure frame

  subplotpars : :class:`SubplotParams`
   Subplot parameters, defaults to rc

  tight_layout : bool
   If ``False`` use *subplotpars*; if ``True`` adjust subplot
   parameters using `.tight_layout` with default padding.
   When providing a dict containing the keys
   ``pad``, ``w_pad``, ``h_pad``, and ``rect``, the default
   `.tight_layout` paddings will be overridden.
   Defaults to rc ``figure.autolayout``.

  constrained_layout : bool
   If ``True`` use constrained layout to adjust positioning of plot
   elements. Like ``tight_layout``, but designed to be more
   flexible. See
   :doc:`/tutorials/intermediate/constrainedlayout_guide`
   for examples. (Note: does not work with :meth:`.subplot` or
   :meth:`.subplot2grid`.)
   Defaults to rc ``figure.constrained_layout.use``.
  """
  Artist.__init__(self)
  # remove the non-figure artist _axes property
  # as it makes no sense for a figure to be _in_ an axes
  # this is used by the property methods in the artist base class
  # which are over-ridden in this class
  del self._axes
  self.callbacks = cbook.CallbackRegistry()

  if figsize is None:
   figsize = rcParams['figure.figsize']
  if dpi is None:
   dpi = rcParams['figure.dpi']
  if facecolor is None:
   facecolor = rcParams['figure.facecolor']
  if edgecolor is None:
   edgecolor = rcParams['figure.edgecolor']
  if frameon is None:
   frameon = rcParams['figure.frameon']

  if not np.isfinite(figsize).all():
   raise ValueError('figure size must be finite not '
        '{}'.format(figsize))
  self.bbox_inches = Bbox.from_bounds(0, 0, *figsize)

  self.dpi_scale_trans = Affine2D().scale(dpi, dpi)
  # do not use property as it will trigger
  self._dpi = dpi
  self.bbox = TransformedBbox(self.bbox_inches, self.dpi_scale_trans)

  self.frameon = frameon

  self.transFigure = BboxTransformTo(self.bbox)

  self.patch = Rectangle(
   xy=(0, 0), width=1, height=1,
   facecolor=facecolor, edgecolor=edgecolor, linewidth=linewidth)
  self._set_artist_props(self.patch)
  self.patch.set_aa(False)

  self._hold = rcParams['axes.hold']
  if self._hold is None:
   self._hold = True

  self.canvas = None
  self._suptitle = None

  if subplotpars is None:
   subplotpars = SubplotParams()

  self.subplotpars = subplotpars
  # constrained_layout:
  self._layoutbox = None
  # set in set_constrained_layout_pads()
  self.set_constrained_layout(constrained_layout)

  self.set_tight_layout(tight_layout)

  self._axstack = AxesStack() # track all figure axes and current axes
  self.clf()
  self._cachedRenderer = None

  # groupers to keep track of x and y labels we want to align.
  # see self.align_xlabels and self.align_ylabels and
  # axis._get_tick_boxes_siblings
  self._align_xlabel_grp = cbook.Grouper()
  self._align_ylabel_grp = cbook.Grouper()
综上所述,我们通过matplotlib.figure.Figure()来创建得到的fig,并不具备manager的属性,而通过plt.figure()创建的fig,就默认创建了manager。
二 . renderer(渲染器),默认是tkagg
对应抽象的类:RendererBase and GraphicsContextBase
作用:
- 很多渲染操作都传递给一个额外的抽象:GraphicsContextBase,它为处理颜色、线条样式、起始样式、混合属性和反混叠选项等的代码提供了一个干净的分离。
Qt & matplotlib示例代码
#import modules from Matplotlib from matplotlib.backends.backend_qt4agg import FigureCanvasQTAgg as FigureCanvas from matplotlib.backends.backend_qt4agg import NavigationToolbar2QTAgg as NavigationToolbar import matplotlib.pyplot as plt #import random module to generate set import random class Window(QtGui.QDialog): def __init__(self, parent=None): super(Window, self).__init__(parent) #init figure and canvas self.figure = plt.figure() self.canvas = FigureCanvas(self.figure) #init nav toolbar self.toolbar = NavigationToolbar(self.canvas, self) # Add plot button self.button = QtGui.QPushButton('Plot') # connect button to custom slot (see later) self.button.clicked.connect(self.plot) # set the layout layout = QtGui.QVBoxLayout() layout.addWidget(self.toolbar) layout.addWidget(self.canvas) layout.addWidget(self.button) self.setLayout(layout) ### our custom slot def plot(self): # random data data = [random.random() for i in range(25)] # create an axis ax = self.figure.add_subplot(1,1,1) # discards the old graph ax.hold(False) # plot data ax.plot(data, '*') # refresh canvas self.canvas.draw()三. Problems(GUI画3D不能旋转)
一个Axes3D创建callback函数给画布上的图形实现旋转特性。如果说先给图形(figure)增加axes或者其他配件的时候,在之后将图形附加到画布的时候,之前添加的axes的callback函数可能不能够接收消息事件,也就没办法在绘出的GUI实现旋转的性能。
所以应该先将图形附加到画布上,然后再对图形增加axes和其他的配件。
FigureCanvas(figure,canvas)
figure:需要附加的图形(添加者),canvas提供渲染功能的对象(承载者)
每一次你调用FigureCanvas()的时候,你都是将图形附加到新画布上(这不是你所看到的的那个canvas),于是 the call-backs函数将不会被射击(接收事件信号),因为他们正在监听一个你看不到的canvas。
四 . 附录
以上这篇浅谈matplotlib中FigureCanvasXAgg的用法就是小编分享给大家的全部内容了,希望能给大家一个参考,也希望大家多多支持python博客。
-
<< 上一篇 下一篇 >>
标签:matplotlib
浅谈matplotlib中FigureCanvasXAgg的用法
看: 1792次 时间:2020-09-18 分类 : python教程
- 相关文章
- 2021-12-20Python 实现图片色彩转换案例
- 2021-12-20python初学定义函数
- 2021-12-20图文详解Python如何导入自己编写的py文件
- 2021-12-20python二分法查找实例代码
- 2021-12-20Pyinstaller打包工具的使用以及避坑
- 2021-12-20Facebook开源一站式服务python时序利器Kats详解
- 2021-12-20pyCaret效率倍增开源低代码的python机器学习工具
- 2021-12-20python机器学习使数据更鲜活的可视化工具Pandas_Alive
- 2021-12-20python读写文件with open的介绍
- 2021-12-20Python生成任意波形并存为txt的实现
-
搜索
-
-
推荐资源
-
Powered By python教程网 鲁ICP备18013710号
python博客 - 小白学python最友好的网站!