灰度图显示为伪彩色图
法一
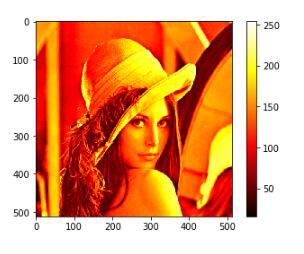
import matplotlib.pyplot as plt

img = plt.imread('C:/Users/leex/Desktop/lena.jpg')
img_s = img[:,:,0]# 直接读入的img为3通道,这里用直接赋值的方法转为单通道
sc = plt.imshow(img_s)
sc.set_cmap('hot')# 这里可以设置多种模式
plt.colorbar()# 显示色度条
效果
限制范围
import matplotlib.pyplot as plt

img = plt.imread('C:/Users/leex/Desktop/lena.jpg')
img_s = img[:,:,0]
sc = plt.imshow(img_s)
sc.set_cmap('hot')
sc.set_clim(0,100)
plt.colorbar()
效果

法二
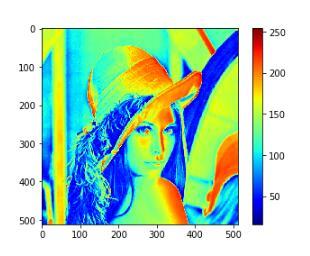
import matplotlib.pyplot as plt

img = plt.imread('C:/Users/leex/Desktop/lena.jpg')
img_s = img[:,:,0]
sc = plt.imshow(img_s, cmap = plt.cm.jet)# 设置cmap为RGB图
plt.colorbar()# 显示色度条
效果
限制范围
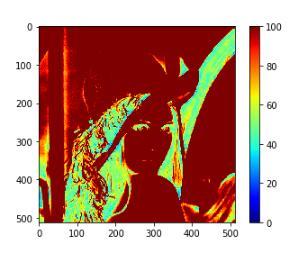
import matplotlib.pyplot as plt

img = plt.imread('C:/Users/leex/Desktop/lena.jpg')
img_s = img[:,:,0]
sc = plt.imshow(img_s, vmin=0, vmax = 100, cmap = plt.cm.jet)# 限制范围为0-100
plt.colorbar()
效果
以上这篇matplotlib实现显示伪彩色图像及色度条就是小编分享给大家的全部内容了,希望能给大家一个参考,也希望大家多多支持python博客。
-
<< 上一篇 下一篇 >>
标签:matplotlib
matplotlib实现显示伪彩色图像及色度条
看: 1374次 时间:2021-01-20 分类 : python教程
- 相关文章
- 2021-12-20Python 实现图片色彩转换案例
- 2021-12-20python初学定义函数
- 2021-12-20图文详解Python如何导入自己编写的py文件
- 2021-12-20python二分法查找实例代码
- 2021-12-20Pyinstaller打包工具的使用以及避坑
- 2021-12-20Facebook开源一站式服务python时序利器Kats详解
- 2021-12-20pyCaret效率倍增开源低代码的python机器学习工具
- 2021-12-20python机器学习使数据更鲜活的可视化工具Pandas_Alive
- 2021-12-20python读写文件with open的介绍
- 2021-12-20Python生成任意波形并存为txt的实现
-
搜索
-
-
推荐资源
-
Powered By python教程网 鲁ICP备18013710号
python博客 - 小白学python最友好的网站!