这篇文章主要介绍了Python散点图与折线图绘制过程解析,文中通过示例代码介绍的非常详细,对大家的学习或者工作具有一定的参考学习价值,需要的朋友可以参考下
在数据分析的过程中,经常需要将数据可视化,目前常使用的:散点图 折线图
需要import的外部包 一个是绘图 一个是字体导入
import matplotlib.pyplot as plt
from matplotlib.font_manager import FontProperties
在数据处理前需要获取数据,从TXT XML csv excel 等文本中获取需要的数据,保存到list
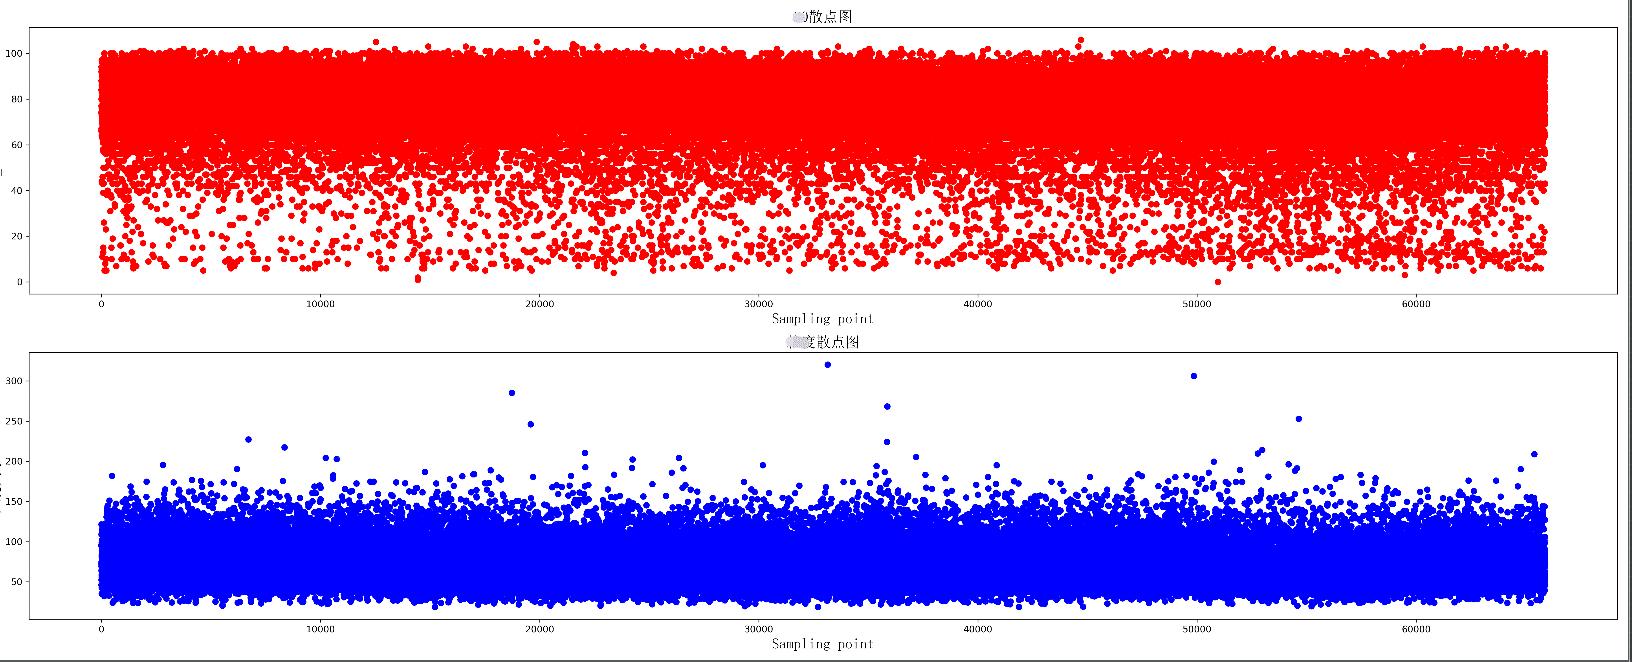
def GetFeatureList(full_path_file):
  file_name = full_path_file.split('\\')[-1][0:4]
  # print(file_name)
  # print(full_name)
  K0_list = []
  Area_list = []
  all_lines = []
  f = open(full_path_file,'r')
  all_lines = f.readlines()
  lines_num = len(all_lines)
  # 数据清洗
  if lines_num > 5000:
    for i in range(3,lines_num-1):
      temp_k0 = int(all_lines[i].split('\t')[1])
      if temp_k0 == 0:
        K0_list.append(ComputK0(all_lines[i]))
      else:
        K0_list.append(temp_k0)
      Area_list.append(float(all_lines[i].split('\t')[15]))
    # K0_Scatter(K0_list,Area_list,file_name)
  else:
    print('{} 该样本量少于5000'.format(file_name))
  return K0_list, Area_list,file_name
绘制两组数据的散点图,同时绘制两个散点图,上下分布在同一个图片中
def K0_Scatter(K0_list, area_list, pic_name):
  plt.figure(figsize=(25, 10), dpi=300)
  # 导入中文字体,及字体大小
  zhfont = FontProperties(fname='C:/Windows/Fonts/simsun.ttc', size=16)
  ax = plt.subplot(211)
  # print(K0_list)
  ax.scatter(range(len(K0_list)), K0_list, c='r', marker='o')
  plt.title(u'散点图', fontproperties=zhfont)
  plt.xlabel('Sampling point', fontproperties=zhfont)
  plt.ylabel('K0_value', fontproperties=zhfont)
  ax = plt.subplot(212)
  ax.scatter(range(len(area_list)), area_list, c='b', marker='o')
  plt.xlabel('Sampling point', fontproperties=zhfont)
  plt.ylabel(u'大小', fontproperties=zhfont)
  plt.title(u'散点图', fontproperties=zhfont)
  # imgname = 'E:\\' + pic_name + '.png'
  # plt.savefig(imgname, bbox_inches = 'tight')
  plt.show()
散点图显示
绘制一个折线图 每个数据增加标签
def K0_Plot(X_label, Y_label, pic_name):
  plt.figure(figsize=(25, 10), dpi=300)
  # 导入中文字体,及字体大小
  zhfont = FontProperties(fname='C:/Windows/Fonts/simsun.ttc', size=16)
  ax = plt.subplot(111)
  # print(K0_list)
  ax.plot(X_label, Y_label, c='r', marker='o')
  plt.title(pic_name, fontproperties=zhfont)
  plt.xlabel('coal_name', fontproperties=zhfont)
  plt.ylabel(pic_name, fontproperties=zhfont)
  # ax.xaxis.grid(True, which='major')
  ax.yaxis.grid(True, which='major')
  for a, b in zip(X_label, Y_label):
    str_label = a + str(b) + '%'
    plt.text(a, b, str_label, ha='center', va='bottom', fontsize=10)
  imgname = 'E:\\' + pic_name + '.png'
  plt.savefig(imgname, bbox_inches = 'tight')
  # plt.show()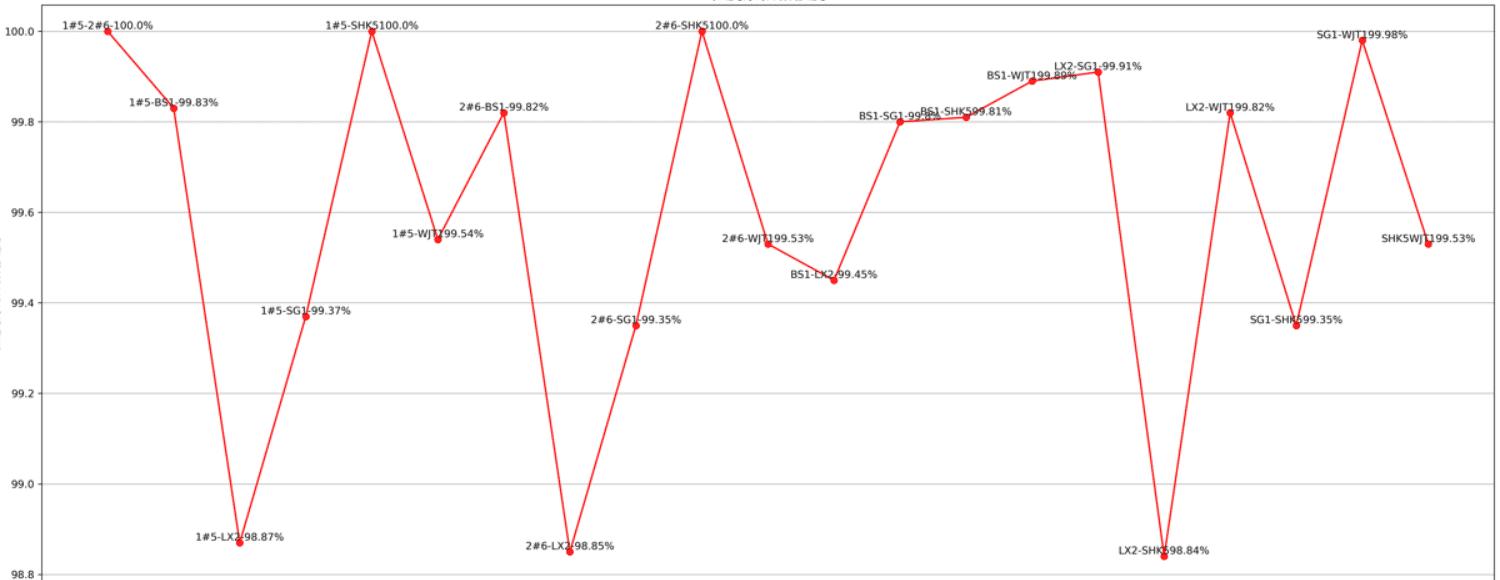
绘制多条折线图
def K0_MultPlot(dis_name, dis_lsit, pic_name):
  plt.figure(figsize=(80, 10), dpi=300)
  # 导入中文字体,及字体大小
  zhfont = FontProperties(fname='C:/Windows/Fonts/simsun.ttc', size=16)
  ax = plt.subplot(111)
  X_label = range(len(dis_lsit[1]))
  p1 = ax.plot(X_label, dis_lsit[1], c='r', marker='o',label='Euclidean Distance')
  p2 = ax.plot(X_label, dis_lsit[2], c='b', marker='o',label='Manhattan Distance')
  p3 = ax.plot(X_label, dis_lsit[4], c='y', marker='o',label='Chebyshev Distance')
  p4 = ax.plot(X_label, dis_lsit[5], c='g', marker='o',label='weighted Minkowski Distance')
  plt.legend()
  plt.title(pic_name, fontproperties=zhfont)
  plt.xlabel('coal_name', fontproperties=zhfont)
  plt.ylabel(pic_name, fontproperties=zhfont)
  # ax.xaxis.grid(True, which='major')
  ax.yaxis.grid(True, which='major')
  for a, b,c in zip(X_label, dis_lsit[5],dis_name):
    str_label = c + '_'+ str(b)
    plt.text(a, b, str_label, ha='center', va='bottom', fontsize=5)
  imgname = 'E:\\' + pic_name + '.png'
  plt.savefig(imgname,bbox_inches = 'tight')
  # plt.show()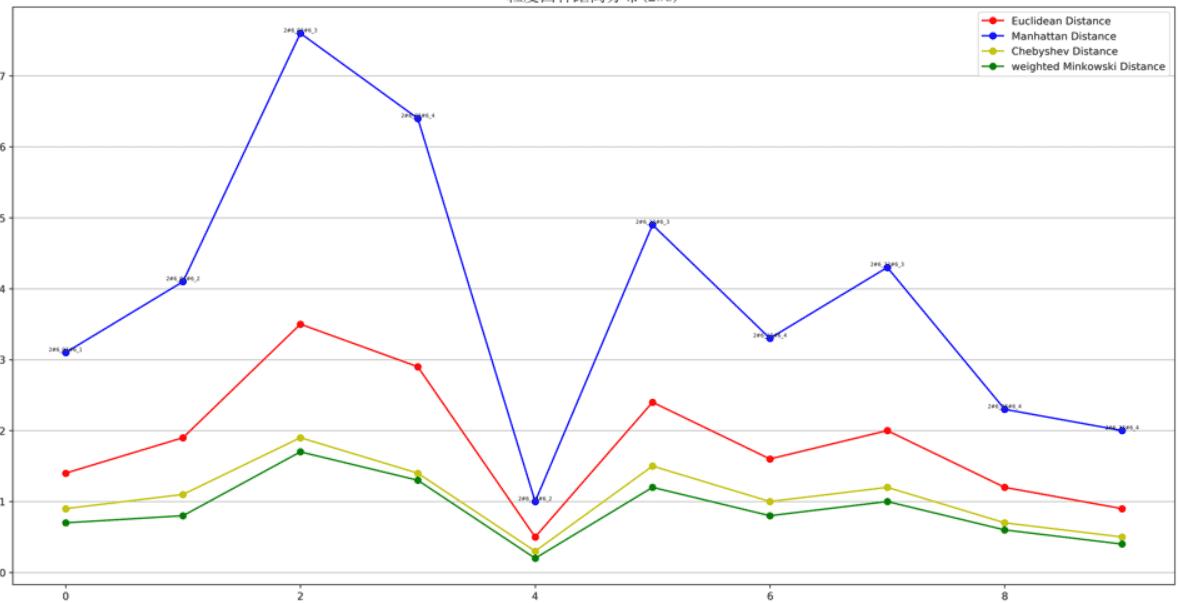
图形显示还有许多小技巧,使得可视化效果更好,比如坐标轴刻度的定制,网格化等
以上就是本文的全部内容,希望对大家的学习有所帮助,也希望大家多多支持python博客。
-
<< 上一篇 下一篇 >>
标签:matplotlib
Python散点图与折线图绘制过程解析
看: 1651次 时间:2021-01-29 分类 : python教程
- 相关文章
- 2021-12-20Python 实现图片色彩转换案例
- 2021-12-20python初学定义函数
- 2021-12-20图文详解Python如何导入自己编写的py文件
- 2021-12-20python二分法查找实例代码
- 2021-12-20Pyinstaller打包工具的使用以及避坑
- 2021-12-20Facebook开源一站式服务python时序利器Kats详解
- 2021-12-20pyCaret效率倍增开源低代码的python机器学习工具
- 2021-12-20python机器学习使数据更鲜活的可视化工具Pandas_Alive
- 2021-12-20python读写文件with open的介绍
- 2021-12-20Python生成任意波形并存为txt的实现
-
搜索
-
-
推荐资源
-
Powered By python教程网 鲁ICP备18013710号
python博客 - 小白学python最友好的网站!