插值对于一些时间序列的问题可能比较有用。
Show the code directly:
import numpy as np
from matplotlib import pyplot as plt
from scipy.interpolate import interp1d

x=np.linspace(0,10*np.pi,num=20)
y=np.sin(x)
f1=interp1d(x,y,kind='linear')#线性插值
f2=interp1d(x,y,kind='cubic')#三次样条插值
x_pred=np.linspace(0,10*np.pi,num=1000)
y1=f1(x_pred)
y2=f2(x_pred)
plt.plot(x_pred,y1,'r',label='linear')
plt.plot(x_pred,y2,'b--',label='cubic')
plt.legend()
plt.show()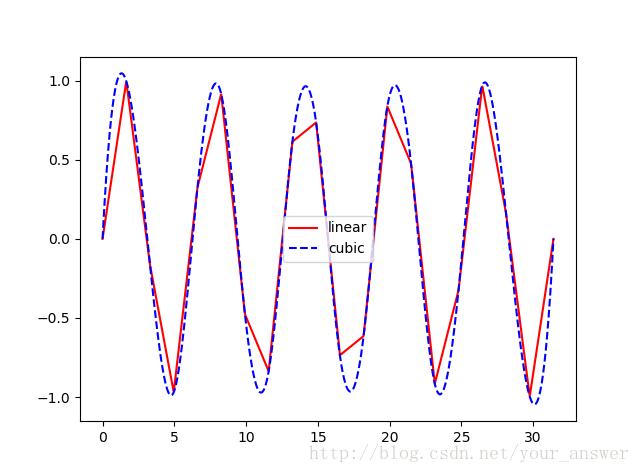
官网上有更详细的参数使用:https://docs.scipy.org/doc/scipy-0.14.0/reference/generated/scipy.interpolate.interp1d.html
以上就是本文的全部内容,希望对大家的学习有所帮助,也希望大家多多支持python博客。
-
<< 上一篇 下一篇 >>
标签:numpy matplotlib
python的scipy实现插值的示例代码
看: 1780次 时间:2021-02-25 分类 : python教程
- 相关文章
- 2021-12-20Python 实现图片色彩转换案例
- 2021-12-20python初学定义函数
- 2021-12-20图文详解Python如何导入自己编写的py文件
- 2021-12-20python二分法查找实例代码
- 2021-12-20Pyinstaller打包工具的使用以及避坑
- 2021-12-20Facebook开源一站式服务python时序利器Kats详解
- 2021-12-20pyCaret效率倍增开源低代码的python机器学习工具
- 2021-12-20python机器学习使数据更鲜活的可视化工具Pandas_Alive
- 2021-12-20python读写文件with open的介绍
- 2021-12-20Python生成任意波形并存为txt的实现
-
搜索
-
-
推荐资源
-
Powered By python教程网 鲁ICP备18013710号
python博客 - 小白学python最友好的网站!