PyQtGraph是纯Python的,只是它底层调用的是PyQt,也就是Qt的Python封装,底层用C/C++语言开发的库,它是在PyQt的基础上开发的可视化控件,相较于老牌的绘制库,PyQtGraph在绘图速度上特别突出,保证绘图的美观性以及强大功能前提下,能够极高的效率去绘制图形,下面一起来详细了解下使用技巧吧。
pyqtgraph库安装:
pip install --user pyqtgraph更快安装方式:
pip3.8 install -i https://mirrors.aliyun.com/pypi/simple导入方式:
import pyqtgraph as pg自带实例模块:
python -m pyqtgraph.examples绘制折线图:
from pyqtgraph.Qt import QtGui, QtCore
import pyqtgraph as pg
from pyqtgraph.widgets.RemoteGraphicsView import RemoteGraphicsView
app = pg.mkQApp()
v = RemoteGraphicsView(debug=False)
v.show()
v.setWindowTitle('单1的折线图')
plt = v.pg.PlotItem()
v.setCentralItem(plt)
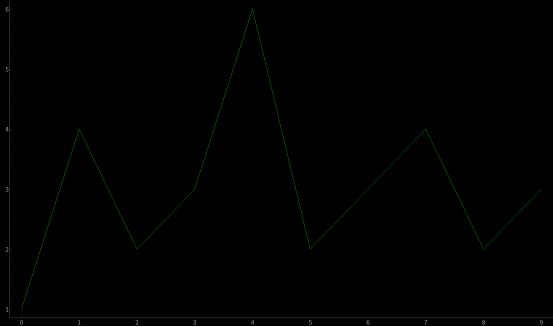
y1=[1,4,2,3,6,2,3,4,2,3]
plt.plot(y1, pen='g')
QtGui.QApplication.instance().exec_()
效果展示:

到此这篇关于python中pyqtgraph知识点总结的文章就介绍到这了,更多相关python中pyqtgraph是什么内容请搜索python博客以前的文章或继续浏览下面的相关文章希望大家以后多多支持python博客!
-
<< 上一篇 下一篇 >>
python中pyqtgraph知识点总结
看: 1411次 时间:2021-03-09 分类 : python教程
- 相关文章
- 2021-12-20Python 实现图片色彩转换案例
- 2021-12-20python初学定义函数
- 2021-12-20图文详解Python如何导入自己编写的py文件
- 2021-12-20python二分法查找实例代码
- 2021-12-20Pyinstaller打包工具的使用以及避坑
- 2021-12-20Facebook开源一站式服务python时序利器Kats详解
- 2021-12-20pyCaret效率倍增开源低代码的python机器学习工具
- 2021-12-20python机器学习使数据更鲜活的可视化工具Pandas_Alive
- 2021-12-20python读写文件with open的介绍
- 2021-12-20Python生成任意波形并存为txt的实现
-
搜索
-
-
推荐资源
-
Powered By python教程网 鲁ICP备18013710号
python博客 - 小白学python最友好的网站!