引言
膨胀与腐蚀是图像处理中两种最基本的形态学操作,膨胀将目标点融合到背景中,向外部扩展,腐蚀与膨胀意义相反,消除连通的边界,使边界向内收缩。在本文中我们将了解使用内核的图像膨胀与腐蚀的基本原理。
让我们开始吧,同样我们需要导入必需的库。
import numpy as np
import matplotlib.pyplot as plt
from skimage.io import imread, imshow
from skimage.draw import circle
from skimage.morphology import erosion, dilation
首先让我们创建一个容易操作的形状--一个简单的圆。
circ_image = np.zeros((100, 100))
circ_image[circle(50, 50, 25)] = 1
imshow(circ_image);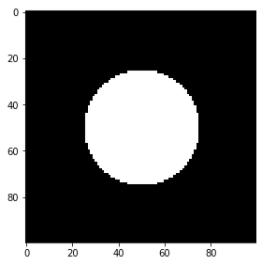
现在让我们定义一个内核。
cross = np.array([[0,1,0],
   [1,1,1],
   [0,1,0]])
imshow(cross, cmap = 'gray');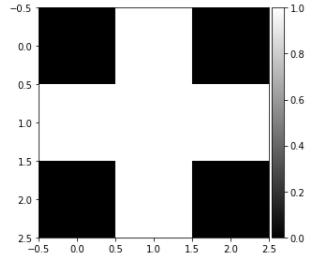
将腐蚀函数应用到创建的圆上。
eroded_circle = erosion(circ_image, cross)
imshow(eroded_circle);
图像看起来几乎一模一样。要看到那些微小的差异,我们必须仔细查看图像。
linecolor = 'red'
fig, ax = plt.subplots(1, 2, figsize=(12, 5))
ax[0].imshow(circ_image, cmap = 'gray');
ax[0].set_title('Original', fontsize = 19)
ax[0].axvline(x = 25, color = linecolor)
ax[0].axvline(x = 75, color = linecolor)
ax[0].axhline(y = 25, color = linecolor)
ax[0].axhline(y = 75, color = linecolor)
ax[1].imshow(eroded_circle, cmap = 'gray');
ax[1].set_title('Eroded', fontsize = 19)
ax[1].axvline(x = 25, color = linecolor)
ax[1].axvline(x = 75, color = linecolor)
ax[1].axhline(y = 25, color = linecolor)
ax[1].axhline(y = 75, color = linecolor)
fig.tight_layout()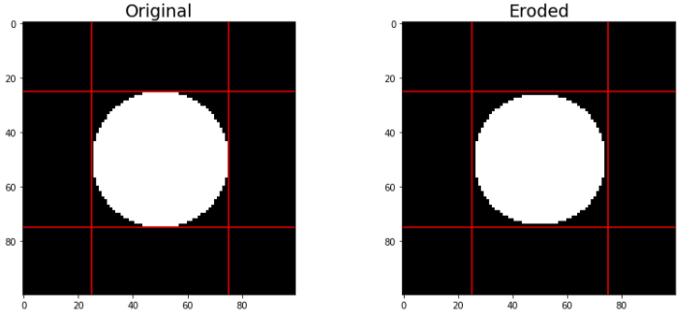
我们可以看到,被腐蚀的圆已经略微缩小了。这就是腐蚀一个对象的意义。如果我们对腐蚀函数进行迭代,它的效果会变得非常明显。
def multi_erosion(image, kernel, iterations):
 for i in range(iterations):
 image = erosion(image, kernel)
 return image
ites = [2,4,6,8,10,12,14,16,18,20]
fig, ax = plt.subplots(2, 5, figsize=(17, 5))
for n, ax in enumerate(ax.flatten()):
 ax.set_title(f'Iterations : {ites[n]}', fontsize = 16)
 new_circle = multi_erosion(circ_image, cross, ites[n])
 ax.imshow(new_circle, cmap = 'gray');
 ax.axis('off')
fig.tight_layout()
上图清楚地显示了图像是如何被腐蚀的。现在让我们尝试改变内核,如果我们使用水平线和垂直线内核代替交叉内核会怎样呢?
h_line = np.array([[0,0,0],
   [1,1,1],
   [0,0,0]])
v_line = np.array([[0,1,0],
   [0,1,0],
   [0,1,0]])
fig, ax = plt.subplots(1, 2, figsize=(15, 5))
ax[0].imshow(h_line, cmap='gray');
ax[1].imshow(v_line, cmap='gray');
fig.tight_layout()
ites = [2,4,6,8,10,12,14,16,18,20]
fig, ax = plt.subplots(2, 5, figsize=(17, 5))
for n, ax in enumerate(ax.flatten()):
 ax.set_title(f'Horizontal Iterations : {ites[n]}', fontsize = 12)
 new_circle = multi_erosion(circ_image, h_line, ites[n])
 ax.imshow(new_circle, cmap = 'gray');
 ax.axis('off')
fig.tight_layout()
fig, ax = plt.subplots(2, 5, figsize=(17, 5))
for n, ax in enumerate(ax.flatten()):
 ax.set_title(f'Vertical Iterationss : {ites[n]}', fontsize = 12)
 new_circle = multi_erosion(circ_image, v_line, ites[n])
 ax.imshow(new_circle, cmap = 'gray');
 ax.axis('off')
fig.tight_layout()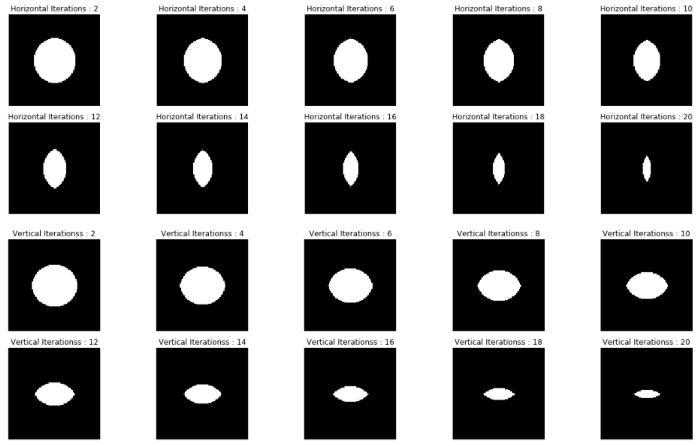
正如我们所看到的,水平和垂直的腐蚀以不同的方式影响着图像。使用水平内核我们得到一个垂直方向细长的圆;而使用垂直内核我们得到一个水平方向细长的圆。
你可能会奇怪,为什么使用垂直内核,会得到一个水平方向细长的圆呢?
因为腐蚀函数是分别寻找垂直和水平的线条,并慢慢把它们削掉。膨胀函数将会让我们更清晰的理解这一点。
使用下面的函数设置处理的图像、膨胀内核以及迭代次数。
def multi_dilation(image, kernel, iterations):
 for i in range(iterations):
 image = dilation(image, kernel)
 return image
让我们看一下处理后的图像有什么不同。
dilated_circle = multi_dilation(circ_image, cross, 1)
linecolor = 'red'
fig, ax = plt.subplots(1, 2, figsize=(12, 5))
ax[0].imshow(circ_image, cmap = 'gray');
ax[0].set_title('Original', fontsize = 19)
ax[0].axvline(x = 25, color = linecolor)
ax[0].axvline(x = 75, color = linecolor)
ax[0].axhline(y = 25, color = linecolor)
ax[0].axhline(y = 75, color = linecolor)
ax[1].imshow(dilated_circle, cmap = 'gray');
ax[1].set_title('Dilated', fontsize = 19)
ax[1].axvline(x = 25, color = linecolor)
ax[1].axvline(x = 75, color = linecolor)
ax[1].axhline(y = 25, color = linecolor)
ax[1].axhline(y = 75, color = linecolor)
fig.tight_layout()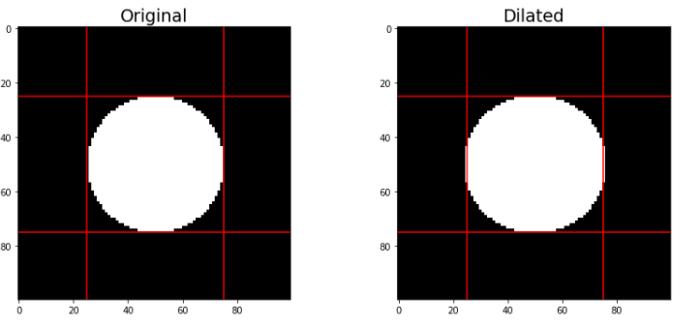
可以清楚地看到圆现在已经越过了红线,这清楚地表明它已经扩大了。现在让我们对水平和垂直扩张进行迭代。
ites = [2,4,6,8,10,12,14,16,18,20]
fig, ax = plt.subplots(2, 5, figsize=(17, 5))
for n, ax in enumerate(ax.flatten()):
 ax.set_title(f'Horizontal Iterations : {ites[n]}', fontsize =
   12)
 new_circle = multi_dilation(circ_image, h_line, ites[n])
 ax.imshow(new_circle, cmap = 'gray');
 ax.axis('off')
fig.tight_layout()
fig, ax = plt.subplots(2, 5, figsize=(17, 5))
for n, ax in enumerate(ax.flatten()):
 ax.set_title(f'Vertical Iterationss : {ites[n]}', fontsize = 12)
 new_circle = multi_dilation(circ_image, v_line, ites[n])
 ax.imshow(new_circle, cmap = 'gray');
 ax.axis('off')
fig.tight_layout()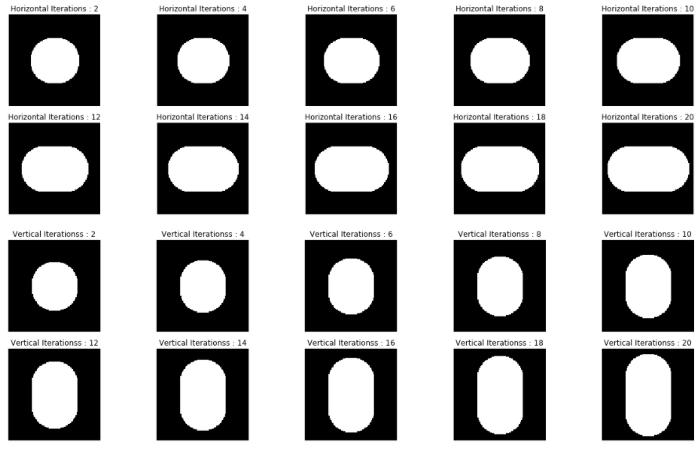
现在可以非常清楚地看到,水平扩张增加了图像宽度,而垂直扩张增加了图像高度。
现在我们已经了解了膨胀与腐蚀的基本原理,下面来看一个相对复杂的图像。
complex_image = imread('complex_image.png')
imshow(complex_image);
在上面的图像中,我们看到了水平线、垂直线和圆的混合物。我们可以使用膨胀和腐蚀函数孤立地观察每一种形状。
为了得到圆,我们可以先腐蚀垂直的线,再腐蚀水平的线。但要记住最后要对图像进行膨胀,因为腐蚀函数同样腐蚀了圆。
step_1 = multi_erosion(complex_image, h_line,3)
step_2 = multi_erosion(step_1, v_line,3)
step_3 = multi_dilation(step_2, h_line,3)
step_4 = multi_dilation(step_3, v_line,3)
steps = [step_1, step_2, step_3, step_4]
names = ['Step 1', 'Step 2', 'Step 3', 'Step 4']
fig, ax = plt.subplots(2, 2, figsize=(10, 10))
for n, ax in enumerate(ax.flatten()):
 ax.set_title(f'{names[n]}', fontsize = 22)
 ax.imshow(steps[n], cmap = 'gray');
 ax.axis('off')
fig.tight_layout()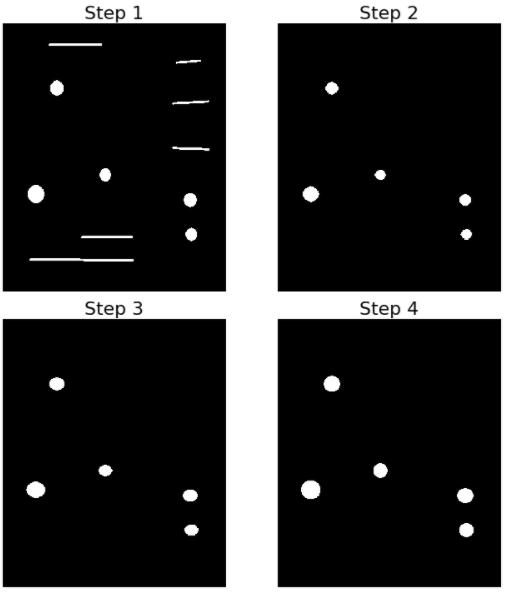
同样,下面的代码将得到水平的线。
step_1 = multi_erosion(complex_image, cross, 20)
step_2 = multi_dilation(step_1, h_line, 20)
step_3 = multi_dilation(step_2, v_line,2)
steps = [step_1, step_2, step_3]
names = ['Step 1', 'Step 2', 'Step 3']
fig, ax = plt.subplots(1, 3, figsize=(10, 10))
for n, ax in enumerate(ax.flatten()):
 ax.set_title(f'{names[n]}', fontsize = 22)
 ax.imshow(steps[n], cmap = 'gray');
 ax.axis('off')
fig.tight_layout()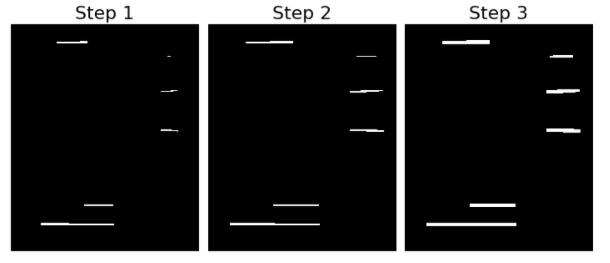
为了得到垂直的线,我们可以创建一个新的内核。
long_v_line = np.array([[0,1,0],
   [0,1,0],
   [0,1,0],
   [0,1,0],
   [0,1,0]])
step_1 = multi_erosion(complex_image, long_v_line, 10)
step_2 = multi_dilation(step_1 ,long_v_line, 10)
steps = [step_1, step_2]
names = ['Step 1', 'Step 2']
fig, ax = plt.subplots(1, 2, figsize=(10, 10))
for n, ax in enumerate(ax.flatten()):
 ax.set_title(f'{names[n]}', fontsize = 22)
 ax.imshow(steps[n], cmap = 'gray');
 ax.axis('off')
fig.tight_layout()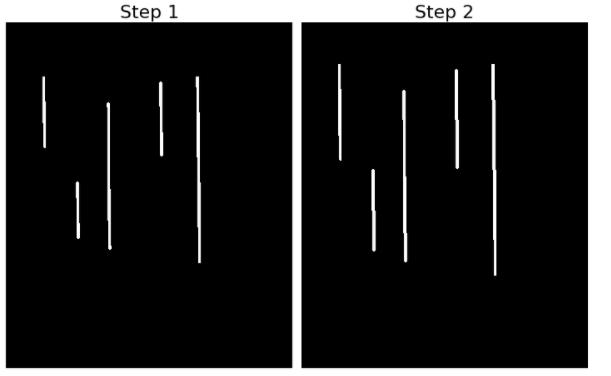
注意,内核并不局限于本文中提到的这几种,可以根据不同的需求自己定义合适的内核。
总结
内核腐蚀和膨胀是图像处理领域需要理解的基本概念。它们甚至可能是任何图像处理模块的第一课。直观地理解它们将是你以后在这个领域成功的关键。
到此这篇关于Python图像处理之膨胀与腐蚀的操作的文章就介绍到这了,更多相关Python图像膨胀与腐蚀内容请搜索python博客以前的文章或继续浏览下面的相关文章希望大家以后多多支持python博客!
-
<< 上一篇 下一篇 >>
标签:flask numpy matplotlib
Python图像处理之膨胀与腐蚀的操作
看: 1878次 时间:2021-04-08 分类 : python教程
- 相关文章
- 2021-12-20Python 实现图片色彩转换案例
- 2021-12-20python初学定义函数
- 2021-12-20图文详解Python如何导入自己编写的py文件
- 2021-12-20python二分法查找实例代码
- 2021-12-20Pyinstaller打包工具的使用以及避坑
- 2021-12-20Facebook开源一站式服务python时序利器Kats详解
- 2021-12-20pyCaret效率倍增开源低代码的python机器学习工具
- 2021-12-20python机器学习使数据更鲜活的可视化工具Pandas_Alive
- 2021-12-20python读写文件with open的介绍
- 2021-12-20Python生成任意波形并存为txt的实现
-
搜索
-
-
推荐资源
-
Powered By python教程网 鲁ICP备18013710号
python博客 - 小白学python最友好的网站!